Fraser Valley Livestock Movement Project

 The Centre for Coastal Health, on behalf of British Columbia’s Ministry of Agriculture and Lands, set out to understand livestock movements into and out of the Fraser Valley that occurred between January 1 and December 31, 2010, using existing and accessible data sources. The motivation for this project came in part from a meeting of government and animal industry representatives in Abbotsford in October of 2009 to discuss how to best prepare British Columbia to respond effectively to an outbreak of a highly infectious disease, such as Foot-and-Mouth disease, within the Fraser Valley. This would help inform British Columbia’s strategic plan for monitoring and controlling animal disease. Knowing the ‘traffic’ patterns of livestock movements in the province would help government and industry respond faster to a foreign animal disease incursion with more effective temporary movement restrictions in order to prevent and limit the spread of disease, as well as to contribute to the faster elimination of the disease and earlier lifting of the temporary movement restrictions.

We focused on livestock operations that maintained databases with livestock movement information (source, destination, species, number of head, date of transport) into and out of the Fraser Valley in 2010. The level of detail supported by actual movement data and the capacity to see month-to-month differences in movement patterns far surpasses what might be obtainable from producer recall of events (e.g. through the administration of questionnaires or interviews). Furthermore, we anticipated that the detail provided by movement databases would better facilitate the identification of year-to-year changes in the patterns of livestock movement.
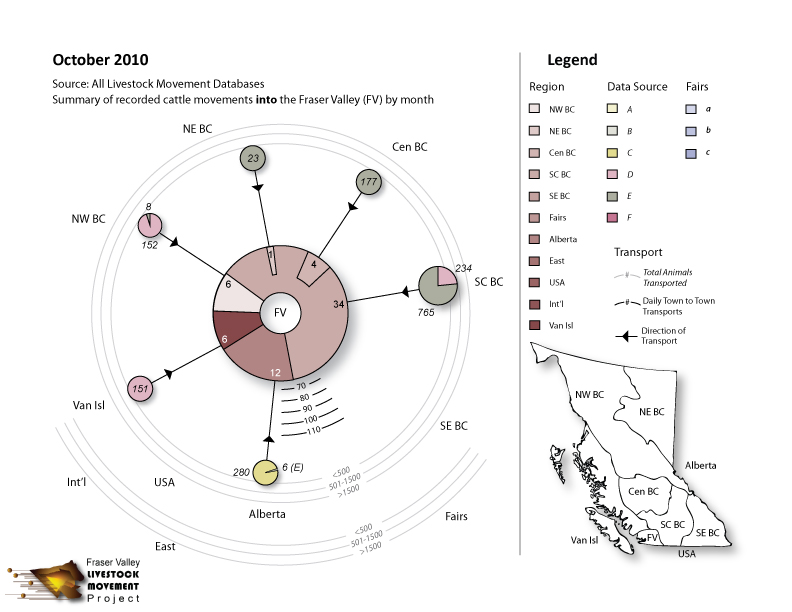
 We recommend that an approach informed by the one taken for this project be considered for capturing future livestock movement ‘snapshots’. The methods for gathering data and constructing the schematics (tables, zone illustrations, town network diagrams) that were trialed with this project and that are shared here could easily be adapted to similar, future, projects. We encourage you to contact us if you would like to explore some of these methods and schematics in further detail.
